Vesica users today will be able to drill down from Vesica charts into detailed data about their collections. This functionality makes interacting with your collections easier, faster and more intuitive. Where as before you could just visualize your collection via the pie charts and would have to search independently to get the list of objects that made up the chart, you can now simply click on the appropriate slice of the pie in the chart, once to slide it out, and a second time to click through to get a list of objects that make up the statistic.
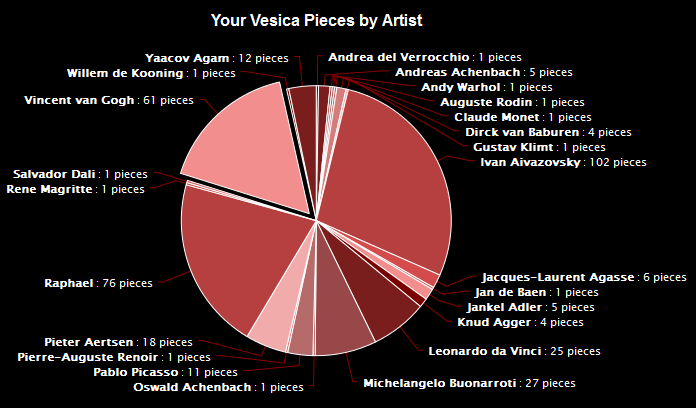
Let’s show you how it works. Below is a pie chart of all the artists who have work listed in the account we’re looking at. You’ll also note in the chart that we’ve clicked on Vincent Van Gogh once, so his piece of the pie has slid out.

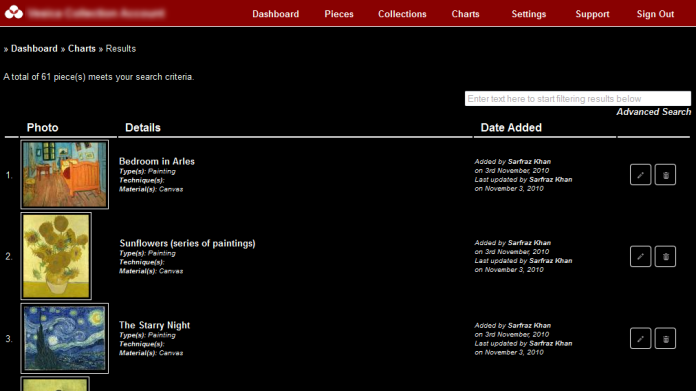
If you clicked on the Van Gogh piece of the pie again, you’ll go to a page that will list all 61 objects in your account which have Van Gogh tagged as the artist.

The drill down functionality has been applied to all 7 charts in Vesica.


