Vesica Blog - Taking museum and art collections to the cloud

February 16, 2013

Using Vesica’s Interactive Timeline

Released in December 2012, the Vesica Timeline allows all Vesica users to see the pieces in their account on an interactive map. Getting your existing collections to appear on the map will require you to define the location of your object in the History / Provenance section in the About tab when editing a piece. Once you’ve defined the location, you can get the map co-ordinates of that location to map the object. The video below gives you a basic demonstration of how to do this:

Once you’ve added the co-ordinates, you can simply browse to your timeline by going to Charts > Timeline. In History / Provenance section, you can also add the date created, which will make sure the object only appears on the map on the selected date. The below video gives you a short glimpse of what the timeline looks like.

September 15, 2012

Getting art collection reports the way you want them

One of the updates scheduled for the last quarter of 2012 in Vesica is a report building tool. Unlike other software where you can generate pre-defined reports, this reporting tool will allow you to print whatever you want on a report.

The report builder will benefit immensely from Vesica’s already powerful search and filter functionality. As it stands, you basically filter, search and drill down in your collection to view objects / pieces by a variety of different parameters – and you get to define and choose these parameters. In the current system, though, you are unable to choose what information about the searched and filtered objects you would like to print on a report. This information is pre-defined and, as such, may not be very useful to all departments in a museum.

But that’s what will change. You will be able to choose what information you want to include on a searched report of objects and pieces, just like you can choose what information you would like to print when creating a detailed object report.

So, illustrated with an example, your current search and filter interface might look like this:

Filter Options

Once you press Search, you’ll get the filtered results. On pressing the print icon on the top right, you’ll be presented with a pop-up allowing you to choose the information you would like to print about each object on the report, as shown below:
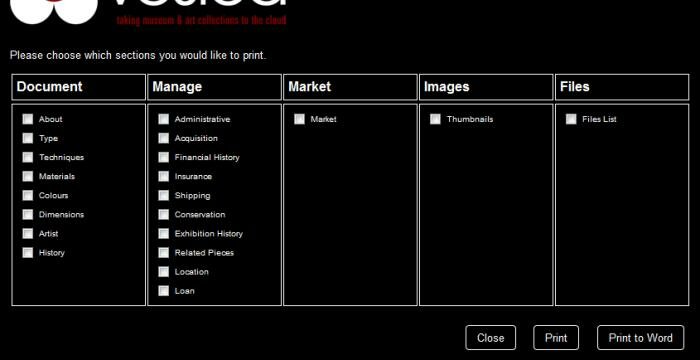
Report Printing Options

Choose and press print or export to word – that’s pretty much all you will need to do to create any report you require. This feature is currently in development and is scheduled for release in November. If you have any suggestions or anything particular you’d like to see implemented along with the report builder, please don’t hesitate to comment and share your thoughts.

June 7, 2012

Multi Lingual Collections Management for Museums

With a user-base that spans over 30 countries, we’re often asked if Vesica supports foreign languages.

The answer is yes.

Vesica uses the UTF-8 character set, so all foreign languages – including Arabic, Hebrew, Hindi, Japanese, etc. are supported. This means you can enter information in virtually any language.

The Vesica interface, however, is currently restricted to English. The application is being internationalized, with our Spanish version due for launch in the next few weeks. In due course, the Vesica interface will also be available in several languages.

If you are museum considering Vesica but the English interface stands in your way, get in touch with us and we can get you an ETA on a localised interface.

April 18, 2012

Google Maps and Interactive Cultural Experiences

CS Fine Arts Center Interactive Google Map

The next version of the Vesica Interactive Timeline will feature a fully searchable, interactive timeline built on Google Maps. Whilst work has been ongoing to integrate the Google Maps API with Vesica along with other features, we recently had the opportunity to build a simple integration for the Introducing America exhibition at the Colorado Springs Fine Arts Center.

For users looking forward to enhancements to the newer timeline feature in Vesica – this is what it will be based on. You’ll be able to select a period and visualize your images in a map, then zoom in to interact with them. You will eventually also be able to further filter the data on this map like you can when you’re searching for pieces / objects in your account. So, in theory, you could ask the map to visualize for you all the objects in your collection between 1820 and 1880, then choose to look at just textiles, and then zoom in to the Far East region and see what you may have in your collections from China on the map.

Once complete, museums will also be able to port the map out to an external website using the API – which can add a new dimension of interactivity to museum websites.

The map for the Colorado Springs Fine Arts Center can be viewed here.

Home    •    Blog    •    Contact Us    •    Developers    •    Education    •    Partners    •    About    •    Help & Support    •    News    •    Privacy Policy    •    Terms of Use